
Bullish candlestick patterns are powerful tools used by traders to analyze market sentiment and predict potential price movements in financial markets. These patterns provide valuable insights into investor behavior, indicating a potential uptrend in the price of an asset.
Table of Contents
In this comprehensive guide, we will explore into the world of bullish candlestick patterns, exploring their significance, how to identify them, and strategies for incorporating them into your trading approach. Whether you’re a novice trader looking to enhance your skills or an experienced investor seeking to refine your technical analysis, understanding bullish candlestick patterns is essential for success in the dynamic world of trading.
Top 5 Bullish Candlestick Patterns
Bullish candlestick patterns are powerful indicators of potential uptrends in the market. In this section, we will explore the most prominent bullish candlestick patterns, providing detailed explanations of each pattern, including their formation, significance, and interpretation.
A. Hammer

The hammer is a bullish reversal pattern that forms after a downtrend. It consists of a small body with a long lower shadow, resembling a hammer. The long lower shadow indicates that sellers pushed the price significantly lower during the session, but buyers regained control, pushing the price back up to close near the session’s high. This pattern suggests that buyers are stepping in to support the price, potentially signaling a reversal in the downtrend.
B. Bullish Engulfing
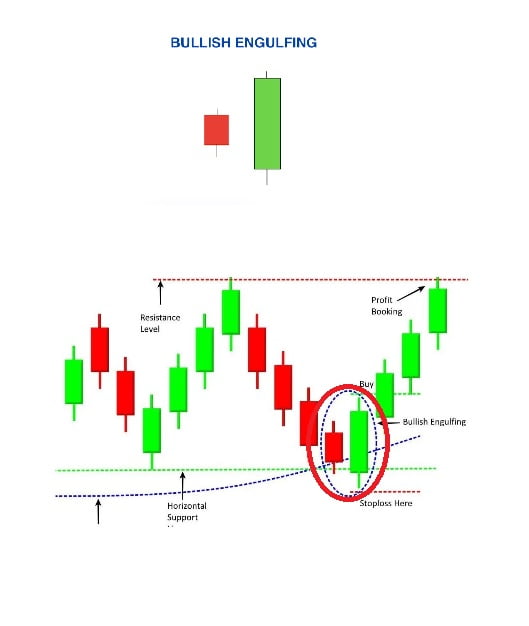
The bullish engulfing pattern occurs when a large bullish candle completely engulfs the previous bearish candle. This pattern signifies a shift in momentum from bearish to bullish. The bullish candle’s large size indicates strong buying pressure, overwhelming the previous selling pressure. Traders often interpret this pattern as a bullish signal, suggesting that buyers have gained control and are likely to push the price higher.
C. Morning Star

The morning star pattern is a three-candle bullish reversal formation. It begins with a long bearish candle, followed by a small-bodied candle (or doji) signaling indecision, and concludes with a large bullish candle. The morning star pattern suggests a reversal from a downtrend to an uptrend, with the small-bodied candle representing a period of consolidation before the bullish breakout. This pattern is often viewed as a strong bullish signal, indicating a potential shift in market sentiment.
D. Piercing Pattern

The piercing pattern is a bullish reversal formation that occurs after a downtrend. It consists of two candles—the first being a bearish candle followed by a bullish candle that closes above the midpoint of the previous bearish candle. The bullish candle’s close above the midpoint of the previous candle suggests a potential reversal, as buyers have managed to push the price significantly higher from the opening level. Traders often interpret this pattern as a bullish signal, indicating a possible shift in momentum.
E. Bullish Harami

The bullish harami pattern involves a small bullish candle within the body of a larger bearish candle. This pattern suggests a potential reversal from a downtrend to an uptrend. The small bullish candle within the bearish candle’s body indicates indecision in the market, with buyers beginning to exert influence despite prevailing selling pressure. Traders interpret this pattern as a bullish signal, suggesting that buyers may be gaining control and pushing the price higher.
These are just a few examples of the top bullish candlestick patterns that traders utilize to identify potential buying opportunities in the market. By understanding the formation and significance of these patterns, traders can make more informed decisions and capitalize on bullish market conditions.
Common Mistakes to Avoid When Identifying Bullish Patterns
- Overlooking Context: Consider the broader market context when interpreting bullish candlestick patterns. A bullish pattern in isolation may not be sufficient to justify a trade if it contradicts prevailing market trends or fundamental factors.
- Ignoring Confirmation Signals: Wait for confirmation signals, such as subsequent price action confirming the pattern’s validity, before entering a trade. Prematurely entering trades based solely on the appearance of a bullish pattern can result in false signals and potential losses.
- Misinterpreting Candlestick Anatomy: Understand the anatomy of candlestick patterns and avoid misinterpreting individual candlesticks. Pay attention to the relationship between the open, high, low, and close prices to accurately identify bullish patterns.
Utilizing Technical Indicators for Confirmation

- Moving Averages: Use moving averages to confirm bullish patterns by assessing the alignment of short-term and long-term moving averages. Bullish crossovers, where shorter-term moving averages cross above longer-term moving averages, can validate bullish signals.
- Relative Strength Index (RSI): Monitor the RSI indicator to gauge the strength of bullish momentum accompanying candlestick patterns. Overbought conditions in the RSI suggest heightened bullish sentiment, while divergences between price and RSI may signal potential trend reversals.
- Volume Indicators: Confirm bullish patterns with increasing trading volume, as higher volume validates the significance of price movements. Volume indicators, such as the on-balance volume (OBV) or volume-weighted average price (VWAP), provide insights into the strength of buying pressure.
By implementing these techniques, traders can effectively identify bullish candlestick patterns and make informed trading decisions based on reliable signals.
Conclusion
Mastering bullish candlestick patterns is essential for traders seeking to identify potential uptrends and profit from favorable market conditions. By understanding the characteristics, types, and strategies associated with bullish patterns, traders can make more informed decisions and improve their trading outcomes.
In this comprehensive guide, we’ve explored the fundamental concepts of bullish candlestick patterns, including their formation, significance, and practical application in trading. From recognizing patterns on price charts to implementing advanced techniques for fine-tuning entry and exit timing, traders have learned valuable strategies for maximizing profits and minimizing risks.
However, achieving mastery in trading requires continuous learning, practice, and adaptation to evolving market conditions. By staying disciplined, patient, and adaptable, traders can navigate the dynamic world of trading with confidence and achieve long-term success.
We encourage traders to apply the knowledge and techniques gained from this guide in their trading endeavors and to continue seeking opportunities for growth and improvement. With dedication and perseverance, mastering bullish candlestick patterns can unlock new opportunities for profitable trading ventures.
Thank you for joining us on this journey to mastering bullish candlestick patterns. Happy trading!
Frequently asked questions (FAQs)
What are bullish candlestick patterns?
Bullish candlestick patterns are formations on price charts that indicate a potential reversal or continuation of an uptrend. These patterns typically consist of one or more bullish candles and often signal buying opportunities in the market.
Why are bullish candlestick patterns important for traders?
Bullish candlestick patterns provide valuable insights into market sentiment and potential price movements. By identifying bullish patterns, traders can anticipate upward price trends, make informed trading decisions, and capitalize on profitable opportunities in the market.
How can I identify bullish candlestick patterns on price charts?
Bullish candlestick patterns can be identified by recognizing specific formations and characteristics on price charts, such as long lower shadows, small or nonexistent upper shadows, and closing prices higher than opening prices. Traders can use technical analysis tools and techniques to confirm the validity of bullish patterns and strengthen their trading signals.
What are some common bullish candlestick patterns to look for?
Some common bullish candlestick patterns include the hammer, bullish engulfing, morning star, piercing pattern, and bullish harami. Each pattern has its own unique formation and significance, providing traders with various opportunities to identify potential uptrends in the market.
How can I trade effectively using bullish candlestick patterns?
To trade effectively using bullish candlestick patterns, traders should wait for confirmed signals, consider additional factors such as volume confirmation and confluence with other technical indicators, and implement risk management techniques such as setting stop-loss and take-profit levels. By combining these strategies, traders can enhance their trading outcomes and maximize profits.
Are there any risks associated with trading bullish candlestick patterns?
Like any trading strategy, there are risks associated with trading bullish candlestick patterns. False signals, market volatility, and unexpected events can impact trade outcomes. It’s important for traders to practice proper risk management, including setting stop-loss orders and diversifying their trading portfolio, to mitigate potential losses and protect their capital.
How can I improve my skills in mastering bullish candlestick patterns?
Improving skills in mastering bullish candlestick patterns requires continuous learning, practice, and experience. Traders can enhance their skills by studying historical price charts, backtesting trading strategies, staying updated with market developments, and seeking guidance from experienced traders or educational resources.