
Does candle really work in stock market?
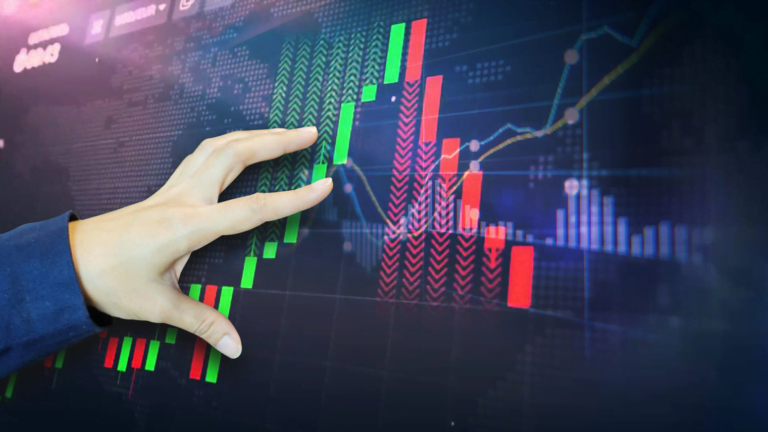
Candlestick charts have become a fundamental tool in the realm of stock market analysis, offering traders a visual representation of price movements and market trends. These charts, characterized by candle-shaped elements, provide valuable insights into the psychology of market participants. In this article, we delve into the question: “Does candle really work in the stock market?” By exploring the intricacies of candlestick patterns and their historical significance, we aim to uncover the effectiveness of candles as a predictive tool in stock trading. Join us on this journey to understand the role and impact of candlestick analysis in navigating the complex landscape of the stock market.
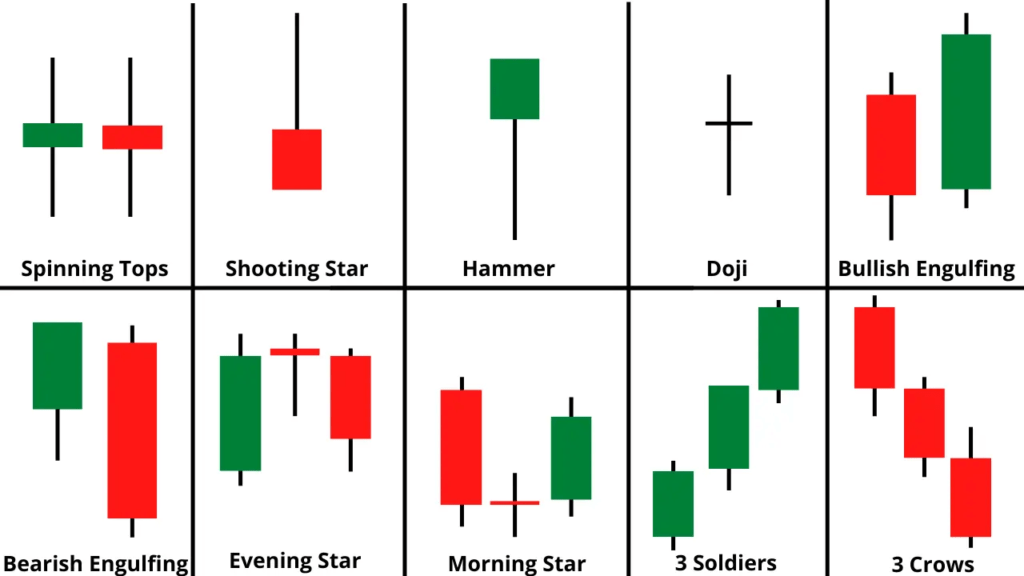
Table of Contents
Understanding Candlestick Patterns
Candlestick patterns form the foundation of technical analysis in the stock market, providing traders with a unique visual representation of price movements over specific time frames. To truly assess whether candles work in the stock market, it’s essential to comprehend the basic components and various patterns associated with candlestick charts.
A. Explanation of Basic Candlestick Components
In its simplest form, a candlestick comprises three main elements: the body, wick, and shadow. The body represents the price range between the opening and closing values for a specific time period. The wick, or shadow, extends from the body and illustrates the highest and lowest prices reached during that period. Understanding these components is crucial for interpreting the information conveyed by each candlestick.
B. Common Candlestick Patterns
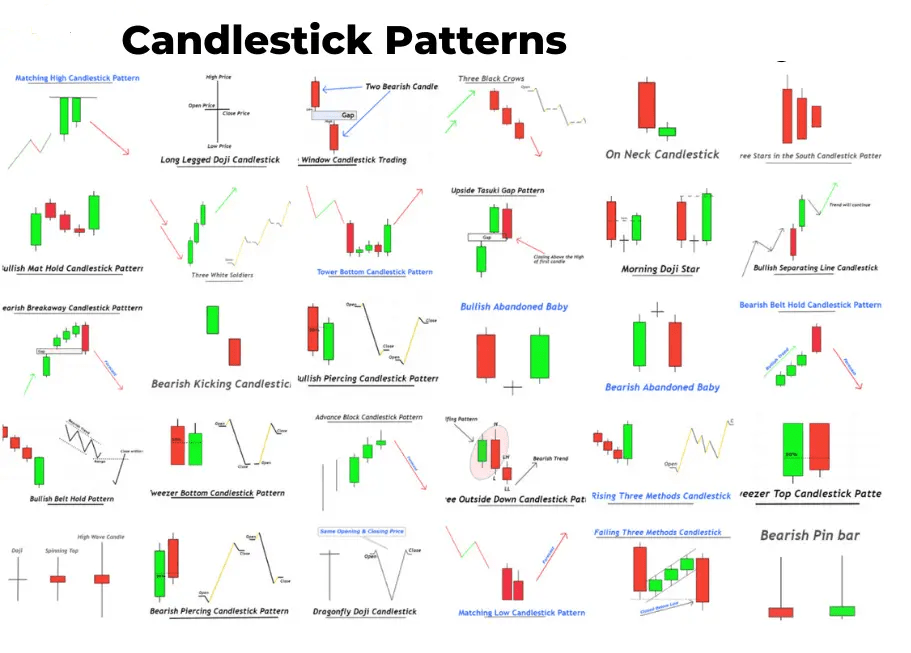
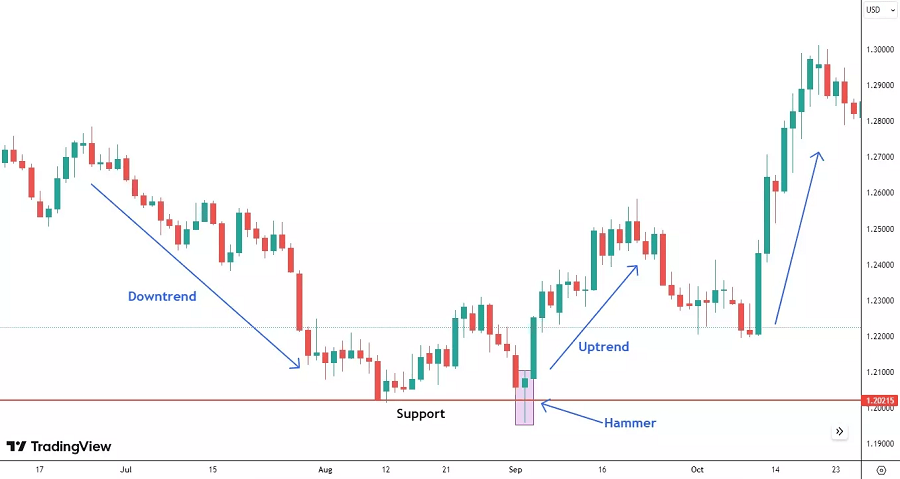
Candlestick charts feature a myriad of patterns, each offering distinct insights into market sentiment. Examples include the doji, which suggests market indecision, and the hammer, indicating a potential reversal. Engulfing patterns, on the other hand, signal a shift in momentum. Exploring these common patterns equips traders with tools to identify potential trends and reversals, enhancing their ability to make informed decisions.
C. Historical Background and Development of Candlestick Analysis
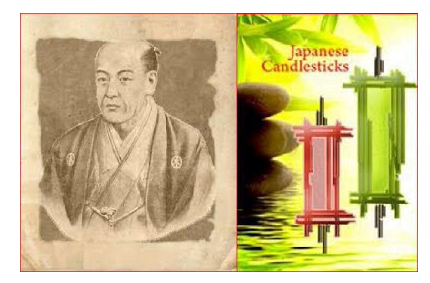
Candlestick analysis traces its origins to Japanese rice traders in the 18th century. Munehisa Homma is often credited as one of the earliest practitioners. Over time, candlestick charts evolved, and their popularity surged with the works of Steve Nison, who introduced them to the Western world. Understanding this historical context helps traders appreciate the rich heritage behind candlestick analysis and its enduring relevance in today’s dynamic stock market.
By grasping the fundamentals of candlestick components, recognizing common patterns, and exploring their historical evolution, traders can lay the groundwork for evaluating the effectiveness of candles in predicting stock market movements. The next section will delve into the practical applications of these candlestick patterns in stock market strategy.
The Role of Candlestick Patterns in Stock Market Strategy
Candlestick patterns are more than just visual representations on a chart; they serve as powerful tools for traders to formulate and execute stock market strategies. In this section, we will explore how traders leverage candlestick patterns to make crucial decisions, identify trend movements, and use signals for entry and exit points in stock trading.
A. How Traders Use Candlestick Patterns to Make Decisions
Successful trading often hinges on the ability to interpret market sentiment accurately. Candlestick patterns, with their diverse forms, offer traders valuable clues about the psychology of market participants. Understanding whether the market is bullish, bearish, or undecided allows traders to make informed decisions about buying or selling, helping them stay ahead of market trends.
B. Identifying Trend Reversals and Continuations with Candles
Candlestick patterns play a pivotal role in identifying potential trend reversals or continuations. Recognizing patterns like the ‘head and shoulders’ or the ‘double top’ can provide early indications of a shift in market direction. Conversely, patterns such as ‘flags’ and ‘pennants’ may suggest that an existing trend is likely to continue. This ability to identify trends early empowers traders to position themselves strategically in the market.
C. Candlestick Signals as Entry and Exit Points in Stock Trading
Timing is crucial in the stock market, and candlestick patterns offer precise signals for entry and exit points. Traders often use patterns like ‘bullish engulfing’ or ‘morning star’ as signals to enter a trade, anticipating upward movements. Conversely, patterns like ‘bearish harami’ or ‘evening star’ might signal a potential downturn, prompting traders to consider exiting or shorting positions. Understanding these signals enhances traders’ ability to execute well-timed and strategic trades.
As we delve deeper into the practical applications of candlestick patterns, real-life examples and case studies will further illustrate their impact on stock market strategy. The following section will provide insights into how candlestick charts contribute to trend analysis and aid in making informed trading decisions.
Analyzing Stock Market Trends with Candlestick Charts
In the dynamic world of stock trading, accurately identifying and interpreting market trends is paramount for making informed decisions. Candlestick charts serve as indispensable tools for traders seeking to analyze trends effectively. In this section, we will explore the importance of trend analysis in stock trading, how candlestick charts aid in this process, and provide examples of successful trend analysis using candlestick patterns.
A. Importance of Trend Analysis in Stock Trading
Understanding the prevailing market trend is crucial for traders aiming to align their strategies with the broader market direction. Candlestick charts, with their visual depiction of price movements, allow traders to assess whether the market is in an uptrend, downtrend, or moving sideways. This knowledge forms the basis for making strategic decisions that capitalize on existing trends or anticipate potential reversals.
B. How Candlestick Charts Aid in Trend Identification
Candlestick patterns offer a unique advantage in trend identification. Certain patterns, such as ‘trendlines’ and ‘channels,’ provide visual cues about the direction and strength of a trend. Additionally, recognizing patterns like ‘bullish/bearish flags’ and ‘cup and handle formations’ aids in identifying potential trend continuations. Traders who adeptly integrate candlestick analysis into their toolkit gain a comprehensive understanding of market trends.
C. Examples of Successful Trend Analysis Using Candlestick Patterns
Real-life examples underscore the practical relevance of candlestick charts in trend analysis. Consider a scenario where a series of ‘higher highs’ and ‘higher lows’ form a classic uptrend pattern. Traders observing this through candlestick charts might identify opportunities to enter long positions or stay invested in the market. Conversely, recognizing ‘lower highs’ and ‘lower lows’ in a series can indicate a downtrend, prompting traders to adjust their strategies accordingly.
As we move forward, case studies and examples will further illustrate the role of candlestick charts in successful trend analysis. The subsequent section will delve into specific cases, examining instances where candlestick analysis accurately predicted market movements and situations where it fell short, offering valuable insights for traders.
Case Studies and Examples
The efficacy of candlestick analysis in the stock market becomes evident when we examine real-life cases and examples. In this section, we will delve into instances where candlestick patterns provided accurate predictions of market movements, as well as scenarios where they fell short. These case studies offer practical insights into the application of candlestick charts in stock trading.
A. Real-Life Examples of Successful Stock Market Predictions Using Candles
- Bullish Engulfing Pattern in Tech Stocks:
- Explore a case where a prominent bullish engulfing pattern formed in the candlestick chart of a leading tech stock.
- Analyze how traders could have used this pattern to predict an upcoming bullish trend and make profitable investment decisions.
- Reversal Signal in a Bear Market:
- Examine a situation where a specific candlestick pattern served as an early signal of a trend reversal during a bear market.
- Highlight how traders could have utilized this information to adjust their positions, potentially minimizing losses or even turning the market sentiment to their advantage.
B. Instances Where Candlestick Analysis Failed to Predict Market Movements
- False Signals and Market Volatility:
- Investigate cases where certain candlestick patterns produced false signals, particularly during periods of high market volatility.
- Discuss the challenges of relying solely on candlestick analysis and the importance of incorporating other technical indicators to confirm signals.
- Market Surprises and Unforeseen Events:
- Explore instances where unexpected events led to market movements that contradicted the predictions based on candlestick patterns.
- Emphasize the dynamic nature of financial markets and the need for traders to remain adaptable and open to adjusting their strategies.
C. Lessons Learned from Both Successful and Unsuccessful Cases
- Balancing Candlestick Analysis with Other Indicators:
- Discuss the importance of integrating candlestick analysis with other technical indicators to enhance the reliability of predictions.
- Emphasize the need for a comprehensive approach to technical analysis, considering multiple factors that influence market dynamics.
- Risk Management Strategies:
- Highlight the role of risk management strategies in mitigating the impact of unsuccessful predictions based on candlestick analysis.
- Provide insights into how traders can implement risk management techniques to protect their capital during uncertain market conditions.
As we navigate through these case studies, the subsequent section will delve into the pros and cons of relying on candlestick patterns in stock market analysis, offering a comprehensive perspective for traders.
Pros and Cons of Relying on Candlestick Patterns
To truly evaluate the effectiveness of candlestick patterns in stock market analysis, it’s essential to weigh the advantages and disadvantages associated with their use. In this section, we will delve into the pros and cons, providing traders with a comprehensive understanding of the benefits and limitations of relying on candlestick patterns in their decision-making process.
A. Advantages of Using Candlestick Patterns in Stock Market Analysis
- Visual Clarity and Interpretation:
- Discuss how the visual representation of price movements in candlestick charts enhances clarity for traders.
- Emphasize the intuitive nature of candlestick patterns, allowing for quick interpretation of market sentiment.
- Identification of Market Psychology:
- Highlight the ability of candlestick patterns to capture shifts in market psychology and sentiment.
- Explore how patterns like doji, hammer, and engulfing patterns provide insights into the balance of power between buyers and sellers.
- Versatility in Timeframes:
- Illustrate how candlestick patterns are versatile and applicable across various timeframes.
- Discuss how short-term and long-term traders can both benefit from incorporating candlestick analysis into their strategies.
B. Limitations and Potential Pitfalls of Relying Solely on Candles
- Subjectivity in Interpretation:
- Address the subjectivity involved in interpreting candlestick patterns, as different traders may perceive the same pattern differently.
- Encourage traders to complement candlestick analysis with objective indicators to reduce interpretational bias.
- False Signals and Market Noise:
- Discuss instances where candlestick patterns may produce false signals, particularly in choppy or volatile market conditions.
- Stress the importance of considering additional confirmation factors to filter out noise and enhance signal reliability.
- Overlooking Fundamental Analysis:
- Explore the risk of solely relying on technical analysis, neglecting the impact of fundamental factors on stock prices.
- Advocate for a holistic approach that integrates both technical and fundamental analysis for more comprehensive decision-making.
C. Recommendations for a Balanced Approach to Trading with Candles
- Combine Candlestick Patterns with Technical Indicators:
- Suggest the integration of candlestick analysis with other technical indicators to strengthen the robustness of trading strategies.
- Provide examples of how combining indicators such as moving averages or RSI can enhance the reliability of signals.
- Continuous Learning and Adaptability:
- Encourage traders to stay updated on market dynamics and continuously expand their knowledge of candlestick patterns.
- Emphasize the importance of adaptability, allowing traders to refine their strategies based on evolving market conditions.
- Risk Management Best Practices:
- Stress the significance of implementing effective risk management strategies to protect capital during uncertain market situations.
- Provide practical tips on setting stop-loss levels and managing position sizes based on individual risk tolerance.
As traders navigate the complexities of the stock market, a balanced approach to utilizing candlestick patterns can lead to more informed and resilient decision-making. The next section will delve into the accuracy of candlestick signals, exploring the factors that influence their reliability in stock market analysis.
Accuracy of Candlestick Signals
Determining the accuracy of candlestick signals is a crucial aspect of utilizing these patterns in stock market analysis. In this section, we will explore the factors that influence the reliability of candlestick signals, discuss the statistical accuracy of certain patterns, and offer insights into how traders can assess and enhance the precision of their candlestick-based strategies.
A. Discussion on the Reliability of Candlestick Patterns
- Historical Performance Analysis:
- Examine the historical performance of specific candlestick patterns in different market conditions.
- Discuss patterns that have demonstrated consistent reliability over time and their relevance in contemporary trading.
- Statistical Studies and Research:
- Highlight relevant studies and research that have evaluated the statistical accuracy of candlestick patterns.
- Discuss findings that provide insights into the probability of success for various patterns, guiding traders in their decision-making process.
B. Factors Influencing the Accuracy of Candlestick Signals
- Volume Confirmation:
- Emphasize the importance of volume confirmation to validate the significance of candlestick signals.
- Discuss how an increase in trading volume can enhance the reliability of signals, indicating strong market participation.
- Market Context and Trends:
- Explore how the accuracy of candlestick signals is influenced by the broader market context and prevailing trends.
- Discuss the effectiveness of certain patterns in different market phases, such as trending markets, ranging markets, and reversals.
- Timeframe Considerations:
- Address the impact of timeframe on the accuracy of candlestick signals.
- Discuss how certain patterns may be more reliable on shorter timeframes for day traders, while others gain significance on longer timeframes for swing or position traders.
C. Expert Opinions and Studies on the Effectiveness of Candlestick Analysis
- Insights from Trading Experts:
- Feature opinions and insights from renowned trading experts on the effectiveness of candlestick analysis.
- Provide perspectives on how experienced traders incorporate candlestick patterns into their overall trading strategies.
- Relevance of Continuous Learning:
- Stress the importance of continuous learning and staying updated on evolving market dynamics.
- Encourage traders to seek expert opinions, attend webinars, and read relevant publications to enhance their understanding of the nuances of candlestick analysis.
As traders navigate the intricate landscape of candlestick signals, understanding the factors influencing accuracy is essential for making well-informed decisions. The subsequent section will offer a comprehensive conclusion, summarizing key insights and providing a final perspective on whether candles truly work in the stock market.
Conclusion
In conclusion, the evaluation of whether candles truly work in the stock market requires a nuanced understanding of candlestick patterns, their historical context, and their practical application. Candlestick charts offer a visual narrative of market sentiment, presenting opportunities for traders to capitalize on trends, reversals, and entry/exit points.
While the advantages of using candlestick patterns in stock market analysis are evident—providing clarity, insight into market psychology, and versatility—the limitations, such as subjectivity and potential false signals, must be acknowledged. Traders are urged to adopt a balanced approach, combining candlestick analysis with other technical indicators, continuous learning, and effective risk management practices.
Ultimately, the accuracy of candlestick signals depends on various factors, including volume confirmation, market context, and timeframe considerations. Expert opinions and statistical studies further contribute to the ongoing dialogue on the effectiveness of candlestick analysis.
As traders navigate the dynamic landscape of the stock market, leveraging candlestick patterns as a valuable tool within a comprehensive trading strategy can enhance decision-making. By staying informed, adaptable, and disciplined, traders can harness the power of candlestick analysis to navigate the complexities of the financial markets.
Frequently Asked Questions (FAQs) on Candlestick Analysis in the Stock Market
Q1: What are candlestick charts, and why are they important in stock market analysis?
A1: Candlestick charts visually represent price movements in the stock market, providing insights into market sentiment. They are crucial for traders as they offer a clear depiction of price trends, reversals, and potential entry/exit points.
Q2: How do I interpret basic components of a candlestick?
A2: A candlestick has three main components—body, wick, and shadow. The body represents the price range between open and close, while the wick and shadow indicate the highest and lowest prices during a specific time period.
Q3: Can candlestick patterns predict market trends accurately?
A3: Candlestick patterns can provide valuable indications of potential trend movements, but their accuracy depends on various factors. It’s essential to consider market context, volume confirmation, and other technical indicators for a more comprehensive analysis.
Q4: Are there specific candlestick patterns with proven historical accuracy?
A4: Certain candlestick patterns, such as engulfing patterns and doji, have demonstrated historical accuracy. However, the reliability of patterns can vary, and it’s advisable to consider statistical studies and expert opinions.
Q5: What are the limitations of relying solely on candlestick analysis?
A5: Relying solely on candlestick analysis can be subjective, and false signals may occur, especially in volatile markets. Traders should be aware of these limitations and complement candlestick analysis with other technical and fundamental indicators.
Q6: How do I enhance the accuracy of candlestick signals in my trading strategy?
A6: To enhance accuracy, consider factors such as volume confirmation, market context, and timeframe considerations. Combining candlestick analysis with other technical indicators, continuous learning, and risk management practices can contribute to a more robust strategy.
Q7: Can candlestick analysis be applied to different trading timeframes?
A7: Yes, candlestick analysis is versatile and applicable across various timeframes, making it suitable for day traders, swing traders, and long-term investors.
Q8: Do experts recommend using candlestick analysis in stock trading?
A8: Many experienced traders incorporate candlestick analysis into their strategies. However, it’s crucial to note that experts often emphasize the importance of a holistic approach, combining various analysis methods for comprehensive decision-making.
Q9: How do I stay updated on evolving candlestick patterns and market dynamics?
A9: Stay informed by reading relevant publications, attending webinars, and seeking insights from experienced traders. Continuous learning and adaptability are key to staying updated on evolving market dynamics.
Q10: Can candlestick analysis be used in conjunction with other technical indicators?
A10: Yes, combining candlestick analysis with other technical indicators, such as moving averages or RSI, can enhance the reliability of signals and provide a more comprehensive view of market conditions.