
Welcome to the dynamic world of day trading, where split-second decisions can make or break your financial success. In this fast-paced environment, the use of technical indicators becomes paramount. These indicators, rooted in market analysis, provide traders with invaluable insights into potential price movements, helping them navigate the complex landscape of stocks, currencies, and commodities.
In this article, we’ll delve into the realm of day trading technical indicators, exploring their significance, the criteria for selecting the best ones, and practical insights on how to integrate them into your trading strategy. Whether you’re a seasoned trader looking to refine your approach or a novice seeking to understand the basics, this guide aims to equip you with the knowledge needed to make informed decisions in the exciting world of day trading. Let’s embark on this journey together, unraveling the mysteries of the best day trading technical indicators.
Understanding Day Trading Technical Indicators
In the heart of successful day trading lies a profound understanding of technical indicators. These tools, rooted in the principles of technical analysis, empower traders to decipher market trends, identify potential entry and exit points, and manage risk effectively. Let’s break down this crucial aspect of day trading.
Definition and Role of Technical Indicators: Technical indicators are mathematical calculations based on historical price, volume, or open interest data. They help traders interpret market behavior and anticipate future price movements. These indicators fall into various categories, including oscillators, trend-following, and volume-based indicators.
Different Types of Technical Indicators:
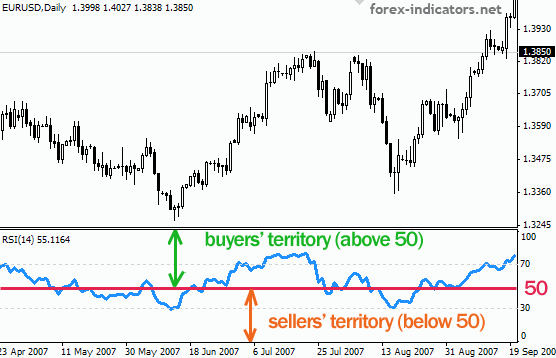
- Oscillators: These indicators oscillate between predefined levels, helping traders identify overbought or oversold conditions. Examples include the Relative Strength Index (RSI) and the Stochastic Oscillator.
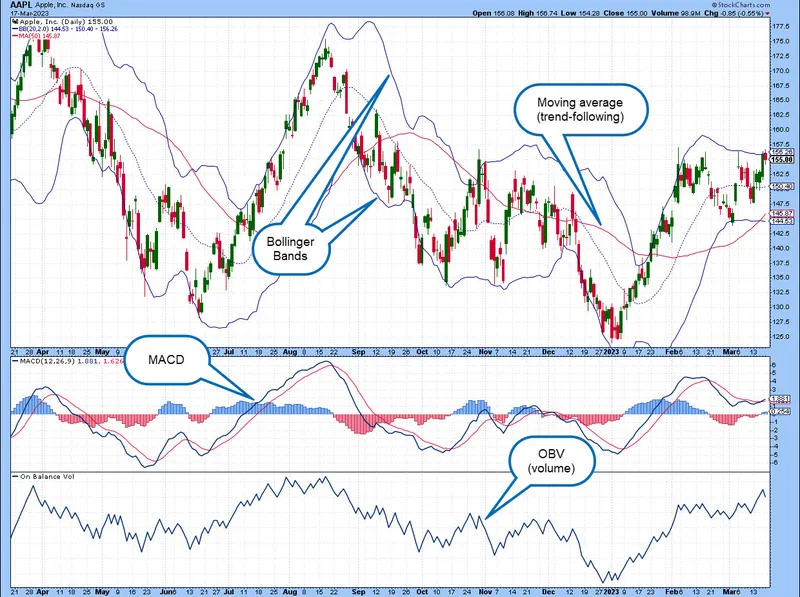
- Trend-following Indicators: These indicators identify the direction and strength of a prevailing trend. Moving Averages (SMA and EMA), Moving Average Convergence Divergence (MACD), and Bollinger Bands fall into this category.
- Volume-based Indicators: These indicators analyze trading volume to gauge the strength of a price movement. On-Balance Volume (OBV) and Chaikin Money Flow are examples of volume-based indicators.
How Technical Indicators Aid Decision-Making: Technical indicators provide traders with visual representations of market conditions, helping them make informed decisions. For instance, moving averages smooth out price data, making it easier to identify trends. Oscillators highlight potential reversal points, while volume-based indicators confirm the strength of a price movement.
Criteria for Selecting the Best Technical Indicators
Selecting the right technical indicators for day trading is a strategic process that requires careful consideration of various factors. The effectiveness of these indicators depends on market conditions, individual trading styles, and specific goals. In this section, we’ll delve into the key criteria to guide you in choosing the best technical indicators for your day trading endeavors.
Importance of Market Conditions: Market conditions play a pivotal role in determining which technical indicators are most effective. Volatile markets may favor oscillators, such as the Relative Strength Index (RSI), which excel in identifying overbought and oversold conditions. In trending markets, moving averages and trend-following indicators like the Moving Average Convergence Divergence (MACD) come to the forefront.
Consideration of Trading Style and Goals: Understanding your trading style and goals is paramount in selecting indicators that align with your approach. Scalpers, aiming for quick profits from short-term price movements, may find oscillators and volatility indicators beneficial. Swing traders, on the other hand, may prefer trend-following indicators to capture larger price swings over several days.
Adaptability of Indicators to Different Timeframes: Day traders operate across various timeframes, from short-term intraday charts to longer daily or weekly charts. The adaptability of technical indicators to different timeframes is a crucial consideration. For instance, a moving average that works well on a 15-minute chart may not be as effective on a daily chart. Traders should choose indicators that suit the specific timeframe they are working with.
By carefully evaluating market conditions, understanding personal trading styles, and considering the adaptability of indicators to different timeframes, day traders can hone in on the most effective technical tools for their unique circumstances. In the following section, we’ll explore some of the most popular day trading technical indicators and how to leverage them for
success.
Popular Day Trading Technical Indicators
In the ever-evolving landscape of day trading, leveraging the right technical indicators can make all the difference. Let’s explore some of the most popular and widely-used day trading technical indicators, each offering unique insights into market dynamics.
Moving Averages:
- Simple Moving Average (SMA): A basic but effective indicator that smoothens price data over a specified period, providing a clear trend direction.
- Exponential Moving Average (EMA): Similar to SMA but places more weight on recent price data, making it more responsive to short-term price changes.
Relative Strength Index (RSI):
- An oscillator that measures the speed and change of price movements, RSI helps identify overbought or oversold conditions, guiding traders on potential trend reversals.
Moving Average Convergence Divergence (MACD):
- This versatile indicator combines two moving averages to highlight changes in the strength, direction, momentum, and duration of a trend, offering comprehensive insights for traders.
Bollinger Bands:
- Comprising a simple moving average and two standard deviation bands, Bollinger Bands help identify volatility and potential reversal points, aiding traders in making well-timed decisions.
Stochastic Oscillator:
- A momentum indicator that compares a security’s closing price to its price range over a specific period, helping traders identify potential trend reversals or continuations.
Fibonacci Retracements:
- Based on the Fibonacci sequence, this tool identifies potential levels of support and resistance, assisting traders in determining entry and exit points.
These indicators, when used individually or in combination, provide day traders with valuable information to interpret market trends, identify potential entry and exit points, and manage risk effectively. In the next section, we’ll delve into the practical aspects of how to use these technical indicators in day trading, offering actionable insights for traders at all levels.
How to Use Technical Indicators in Day Trading
Now that we’ve explored popular day trading technical indicators, the next crucial step is understanding how to integrate them into your trading strategy effectively. In this section, we’ll unravel the practical aspects of using these indicators, providing actionable insights for traders seeking to enhance their decision-making process.
Integrating Multiple Indicators for Confirmation:
- Combine different types of indicators to confirm signals. For example, pairing a trend-following indicator like MACD with an oscillator like RSI can provide a more comprehensive view of market conditions.
Identifying Trend Reversals and Continuations:
- Trend-following indicators like Moving Averages and Bollinger Bands excel at identifying trend direction. Utilize them to identify potential trend reversals or continuations, allowing you to align your trades with the prevailing market sentiment.
Setting Up Trading Signals and Entry/Exit Points:
- Establish clear trading signals based on indicator crossovers, overbought/oversold conditions, or other relevant criteria. Define entry and exit points to execute trades with precision, minimizing emotional decision-making.
Managing Risk with Technical Indicators:
- Leverage technical indicators to implement risk management strategies. For instance, use support and resistance levels identified by Fibonacci Retracements to set stop-loss orders, protecting your capital from significant losses.
Case Studies: Real-Life Examples
Embarking on a journey into the world of day trading technical indicators becomes even more enlightening when we delve into real-life case studies. In this section, we’ll explore concrete examples of successful day trading strategies, showcasing how traders leverage popular technical indicators to achieve consistent profits.
Demonstrating the Application of Indicators in Specific Trades:
- Provide detailed examples of actual trades, illustrating how technical indicators influenced decision-making. Highlight instances where indicators accurately predicted price movements or identified opportune entry and exit points.
Analyzing Successful Day Trading Strategies Using Technical Indicators:
- Break down the thought process behind successful trades. Discuss how a trader identified a favorable setup, which indicators played a key role, and how the trade unfolded. This analysis offers valuable insights into the strategic use of technical indicators.
Showcasing Diverse Market Conditions:
- Present case studies that cover a range of market conditions, including trending markets, ranging markets, and volatile markets. This diversity allows readers to grasp the versatility of technical indicators in adapting to different scenarios.
These real-life case studies serve as practical guides, offering readers a firsthand look at the application of technical indicators in dynamic trading environments. As we move forward, we’ll explore common mistakes to avoid in day trading and provide valuable insights to ensure traders can navigate challenges with resilience and adaptability.
Common Mistakes to Avoid
While mastering day trading technical indicators can significantly enhance your trading prowess, it’s equally crucial to be aware of common pitfalls that traders often encounter. In this section, we’ll dissect these mistakes, offering insights into how to steer clear of potential pitfalls and maintain a robust trading strategy.
Overreliance on a Single Indicator:
- One of the prevalent errors is placing excessive trust in a single indicator. Each indicator has its strengths and limitations. Relying solely on one may lead to false signals and misguided decisions. Instead, consider a holistic approach by combining multiple indicators for a more comprehensive analysis.
Ignoring Market Fundamentals:
- Technical indicators should complement, not replace, an understanding of market fundamentals. Failing to consider broader economic factors, news events, or geopolitical developments may result in overlooking critical influences on asset prices.
Failing to Adapt to Changing Market Conditions:
- Markets are dynamic, and what works exceptionally well in one condition may falter in another. Traders must be adaptive. Recognize shifts in market sentiment, volatility, or trends, and adjust your strategy accordingly. A strategy that thrives in a trending market may struggle in a sideways or choppy market.
By recognizing and avoiding these common pitfalls, day traders can fortify their strategies, fostering resilience and adaptability. In the subsequent section, we’ll provide valuable tips for customizing technical indicators, empowering traders to tailor their approach for optimal effectiveness in various market scenarios.
Tips for Customizing Technical Indicators
Customization is the key to unlocking the full potential of day trading technical indicators. In this section, we’ll explore valuable tips for tailoring these indicators to your specific trading style, preferences, and the ever-changing dynamics of the market.
Adjusting Indicator Parameters:
- Many technical indicators come with adjustable parameters. Experiment with these settings to align the indicator with your preferred timeframes and trading goals. For example, fine-tune the period length of moving averages or the sensitivity of oscillators to suit your strategy.
Creating a Personalized Trading Strategy:
- Develop a trading strategy that integrates technical indicators seamlessly. Consider factors such as risk tolerance, preferred timeframes, and market conditions. Your strategy should be a reflection of your unique approach to trading, incorporating the indicators that resonate most with your style.
Continuously Evaluating and Refining Your Approach:
- The market is dynamic, and what works today may need adjustment tomorrow. Regularly evaluate the effectiveness of your chosen indicators and overall strategy. Be open to refinement, staying attuned to changes in market conditions and continuously learning from your experiences.
Conclusion
As we conclude this exploration into the realm of day trading technical indicators, it’s evident that these tools are indispensable for informed decision-making in the fast-paced world of trading. We’ve covered a spectrum of topics, from understanding the basics and selecting the right indicators to practical application through case studies and avoiding common pitfalls.
Recap of the Importance of Technical Indicators in Day Trading:
- Technical indicators serve as the compass for day traders, offering insights into market trends, entry and exit points, and potential reversals. Their significance lies in providing a structured framework for decision-making, backed by historical price and volume data.
Encouragement for Readers to Experiment and Find What Works Best:
- Every trader’s journey is unique. While this guide provides a solid foundation, it’s essential for readers to experiment with different indicators, timeframes, and strategies. This hands-on approach will help you discover what resonates most with your trading style.
Call to Action for Feedback and Questions:BY
- Your feedback is invaluable. Whether you’re a seasoned trader refining your approach or a newcomer seeking guidance, we welcome your questions and feedback. Feel free to share your experiences, challenges, or successes in the dynamic world of day trading.
In your ongoing pursuit of success in day trading, remember that adaptability and continuous learning are your greatest allies. Stay informed, remain resilient in the face of challenges, and embrace the ever-evolving nature of the markets. Happy trading!
Frequently Asked Questions (FAQs) about Day Trading Technical Indicators:
Q1: What are day trading technical indicators, and why are they important?
Day trading technical indicators are mathematical calculations based on historical price, volume, or open interest data. They are crucial for day traders as they provide insights into market trends, potential entry and exit points, and aid in risk management.
Q2: How do I choose the best technical indicators for day trading?
Consider market conditions, your trading style, and goals. Adaptability to different timeframes is essential. Experiment with a combination of indicators to create a well-rounded strategy.
Q3: Can I rely on a single technical indicator for day trading?
It’s advisable to avoid overreliance on a single indicator. Different indicators offer varied perspectives, and combining them can provide a more comprehensive analysis.
Q4: How do I use technical indicators to set up trading signals and entry/exit points?
Technical indicators generate signals through crossovers, overbought/oversold conditions, or other criteria. Set clear entry and exit points based on these signals, and use them to execute trades with precision.
Q5: What common mistakes should I avoid in day trading with technical indicators?
Avoid overreliance on a single indicator, ignoring market fundamentals, and failing to adapt to changing market conditions. Awareness of these pitfalls is crucial for a robust trading strategy.
Q6: How can I customize technical indicators for my trading strategy?
Adjust indicator parameters, create a personalized trading strategy aligning with your goals, and continuously evaluate and refine your approach based on market dynamics.
Q7: Is day trading only suitable for experienced traders?
Day trading can be suitable for both beginners and experienced traders. However, it requires a solid understanding of markets, risk management, and continuous learning.
Q8: Are there specific technical indicators for volatile markets?
Oscillators like the Relative Strength Index (RSI) and volatility indicators can be useful in volatile markets. However, it’s essential to consider a combination of indicators for a comprehensive analysis.
Q9: Can I apply technical indicators to cryptocurrency day trading?
Yes, technical indicators can be applied to cryptocurrency day trading. The same principles apply, but it’s important to consider the unique characteristics of the cryptocurrency market.
Q10: How often should I reassess and adjust my day trading strategy with technical indicators?
Regularly reassess your strategy, especially during changes in market conditions. Continuous learning and adaptation are essential for sustained success in day trading.