
Unlocking Financial Success: Mastering Key Candlestick pattern
Candlestick patterns play a crucial role in technical analysis, helping traders make informed decisions in the financial markets. In this article, we’ll explore some of the top 7 most successful candlestick patterns and provide real-life examples to illustrate their impact on trading profits.
Table of Contents
Bullish Engulfing Pattern:
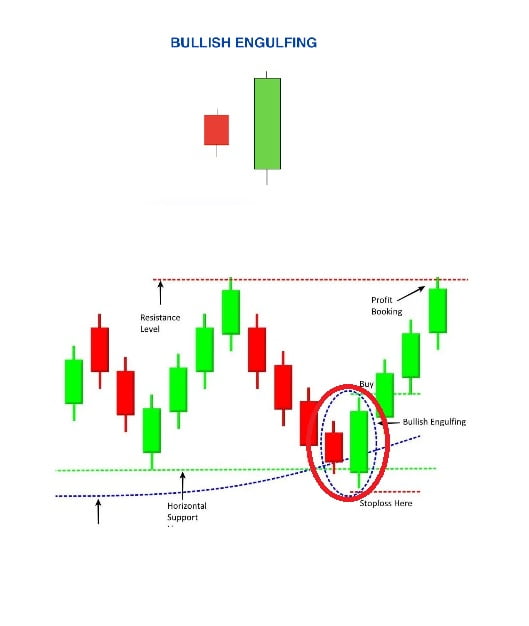
Description: The Bullish Engulfing pattern signals a potential reversal from a downtrend to an uptrend.
Example: Imagine a scenario where the market has been on a downtrend, and suddenly, a large bullish candle completely engulfs the previous bearish candle. This pattern suggests a shift in momentum, indicating a buying opportunity.
Hammer and Hanging Man Patterns:
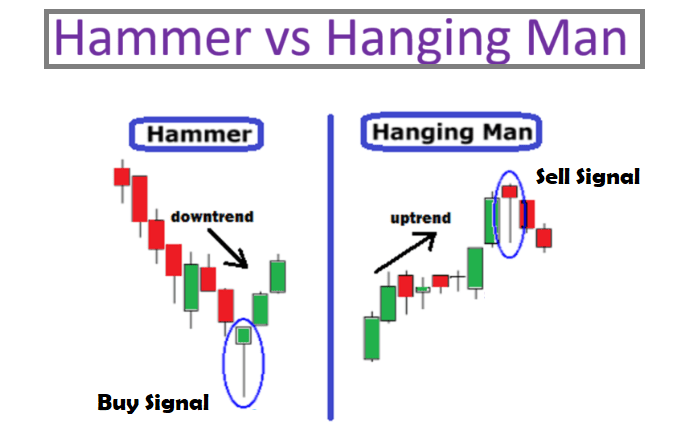
Description: Hammers and Hanging Man patterns are single-candle formations that indicate potential trend reversals.
Example: A Hammer forming after a downtrend may signal a potential bullish reversal(Buy Signal). Conversely, a Hanging Man after an uptrend could suggest a bearish reversal (Sell Signal). Traders often use these patterns to anticipate changes in market direction.
Double Top and Double Bottom Patterns:
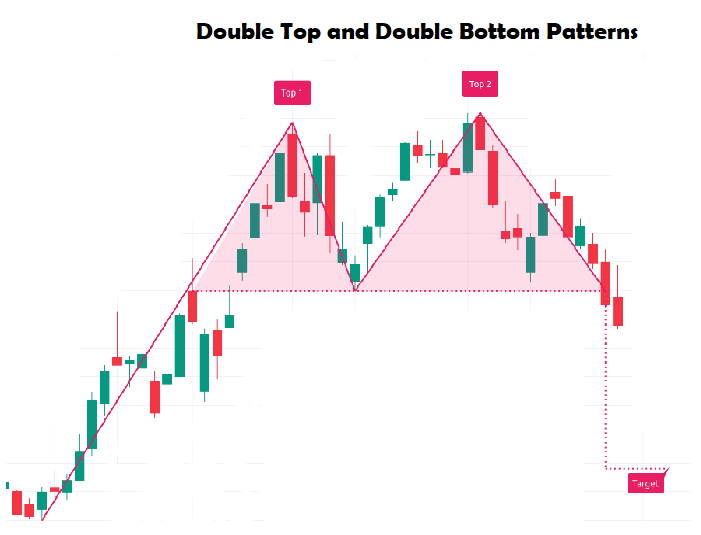
Description: These patterns are reversal patterns that indicate a potential change in the prevailing trend.
Example: A Double Top occurs when an asset’s price reaches a peak twice, signaling a potential downtrend. On the other hand, a Double Bottom, with two price troughs, suggests a potential bullish reversal. Traders often look for confirmation signals before making decisions based on these patterns.
Morning Star and Evening Star Patterns:
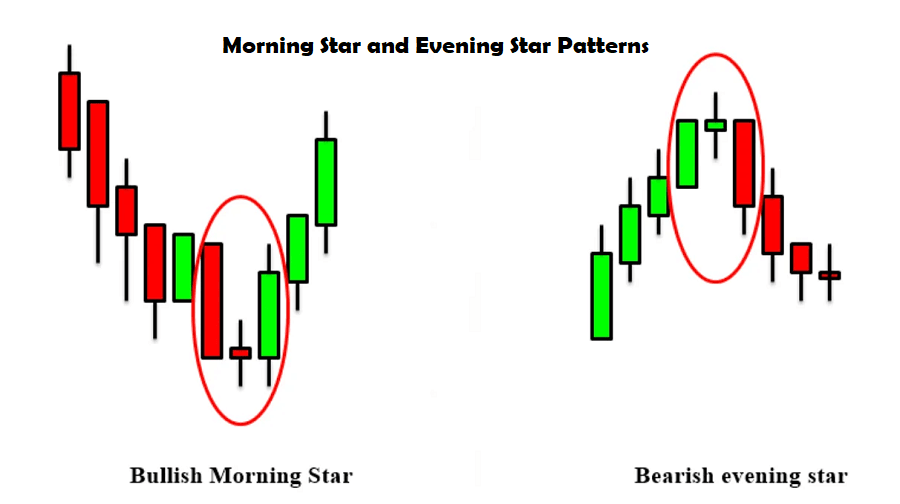
Description: These three-candle patterns signal a reversal in market direction.
Example: A Morning Star, consisting of a bearish candle, a small indecisive candle, and a bullish candle, indicates a potential bullish reversal. Conversely, an Evening Star suggests a bearish reversal. Traders use these patterns in conjunction with other technical indicators for confirmation.
Cup and Handle Pattern:
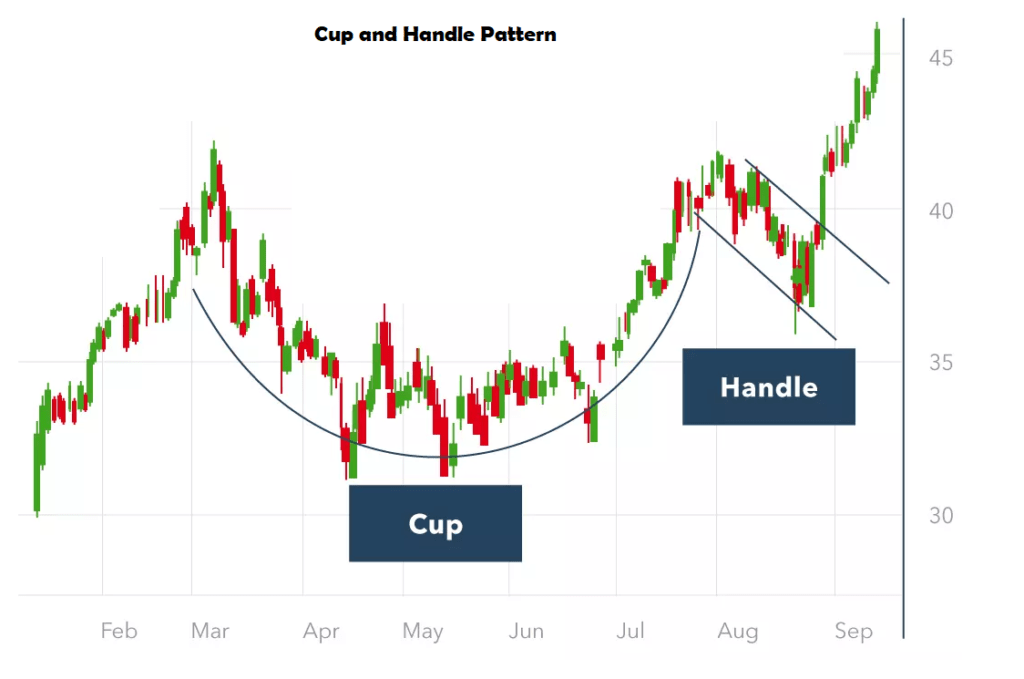
Description: The Cup and Handle is a continuation pattern that often precedes a strong uptrend.
Example: Imagine a cup-shaped formation on a price chart followed by a small consolidation (the handle). This pattern suggests that after a brief consolidation, the upward momentum may resume. Traders often enter long positions when the price breaks out above the handle.
Conclusion:
Mastering candlestick patterns is a valuable skill for any trader. By understanding the nuances of these patterns and using real-life examples for context, you can enhance your ability to make informed decisions in the dynamic world of financial markets. Remember, while candlestick patterns provide valuable insights, it’s crucial to use them in conjunction with other technical and fundamental analysis tools for a comprehensive trading strategy.
FAQs related to top 7 most successful candlestick patterns
Q: How do I identify the Bullish Engulfing pattern on a price chart?
A: Look for a large bullish candle that completely engulfs the previous bearish candle. This pattern suggests a potential reversal from a downtrend to an uptrend.
Q: Can single-candle patterns like Hammers and Hanging Man truly indicate trend reversals?
A: Yes, these patterns can signal potential reversals. For instance, a Hammer after a downtrend may suggest a bullish reversal, while a Hanging Man after an uptrend could indicate a bearish reversal.
Q: Are Double Top and Double Bottom patterns reliable indicators of trend changes?
A: These patterns can be reliable, but confirmation signals are crucial. A Double Top may signal a potential downtrend, while a Double Bottom suggests a potential bullish reversal. Traders often wait for confirmation before making decisions based on these patterns.
Q: How can I use Morning Star and Evening Star patterns in my trading strategy?
A: Morning Star patterns, with three candles indicating a bullish reversal, and Evening Star patterns, suggesting a bearish reversal, are used to anticipate trend changes. Traders often look for confirmation from other indicators before acting on these signals.
Q: What is the significance of the Cup and Handle pattern, and how do I trade it?
A: The Cup and Handle is a continuation pattern indicating a potential uptrend. Traders often enter long positions when the price breaks out above the handle, anticipating a resumption of upward momentum. It’s important to combine this pattern with other analysis tools for a comprehensive trading strategy.