
Candlestick charting is a powerful tool in the world of stock market analysis, providing traders with valuable insights into market trends and potential reversals. These charts, originating from Japanese rice traders in the 17th century, offer a visual representation of price movements, allowing for a more intuitive understanding of market dynamics.
In this article, we delve into the intricacies of candlestick chart patterns, focusing on the top 16 patterns that can significantly impact trading decisions. Understanding these patterns is crucial for both novice and experienced traders, as they serve as key indicators of potential shifts in market sentiment.
Join us on a journey through the fascinating world of candlestick charting as we demystify the top 16 patterns, offering insights, practical tips, and real-world examples to empower you in your stock market endeavors. Whether you’re a seasoned investor or just starting, mastering these patterns can enhance your ability to make informed and strategic trading decisions.
Let’s dive into the art and science of interpreting candlestick charts, unraveling the secrets behind these dynamic and insightful tools for stock market analysis.
16 Candlestick patterns explained with examples
1. 16 Candlestick Patterns Charting Basics – Unlocking the Power of Candlestick Patterns
Candlestick charting serves as a cornerstone in technical analysis, offering traders a visual representation of price movements that goes beyond traditional bar charts. To grasp the essence of candlestick patterns, it’s essential to comprehend their basic components and the historical context that shaped their development.
A. Explanation of Candlestick Components
- Candlestick Anatomy: Each candlestick comprises three main parts – the body, wick (or shadow), and upper/lower shadow. The body represents the price range between the opening and closing, while the wick signifies the highest and lowest prices reached during the trading period.
- Colors and Interpretation: Candlesticks are often colored to indicate bullish (typically green or white) or bearish (usually red or black) sentiment. Understanding these colors aids in quick pattern recognition and interpretation.
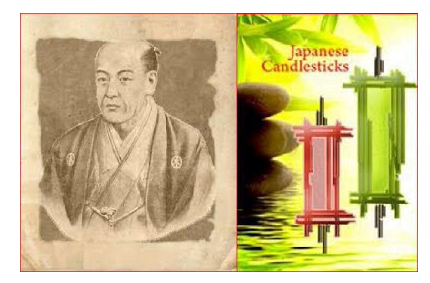
B. Historical Background of Japanese Candlestick Charts
- Origins in Japan: Candlestick charts originated in Japan in the 17th century when rice traders used them to analyze price patterns. Munehisa Homma, a Japanese rice merchant, is credited with developing the early candlestick techniques, which were later refined and popularized.
- Introduction to the West: Candlestick charting gained global recognition in the 20th century, thanks to the efforts of technical analysts like Steve Nison. Nison introduced Japanese candlestick patterns to the Western world through his book “Japanese Candlestick Charting Techniques,” sparking a revolution in market analysis.
C. Advantages of Using Candlestick Charts in Technical Analysis
- Visual Clarity: Candlestick charts offer a clear visual representation of price movements, making it easier for traders to identify trends, reversals, and potential entry/exit points.
- Psychological Insight: The shapes and patterns formed by candlesticks provide insights into market psychology, reflecting the tug-of-war between buyers and sellers. This psychological dimension enhances the predictive power of candlestick analysis.
- Versatility in Timeframes: Candlestick patterns are effective in various timeframes, from intraday trading to long-term investing. This versatility makes them valuable for traders with different time horizons.
2. Top 16 Candlestick Patterns – Navigating the Market Signals
In this section, we delve into the core of candlestick charting— the top 16 candlestick patterns that serve as potent indicators of market dynamics. These patterns, categorized into bullish reversal, bearish reversal, continuation, and doji patterns, offer traders invaluable insights into potential price movements.
A. Bullish Reversal Patterns
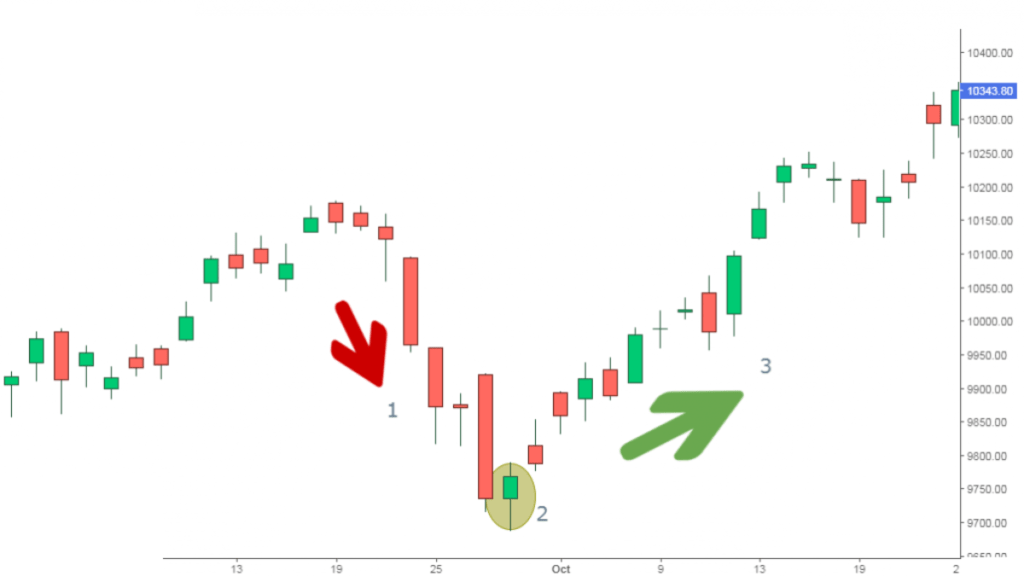
- Hammer:
- Description: The Hammer is a bullish reversal pattern characterized by a small body and a long lower shadow. It signals potential trend reversal after a downtrend.
- Application: Traders use the Hammer to identify buying opportunities, anticipating a shift in sentiment from bearish to bullish.
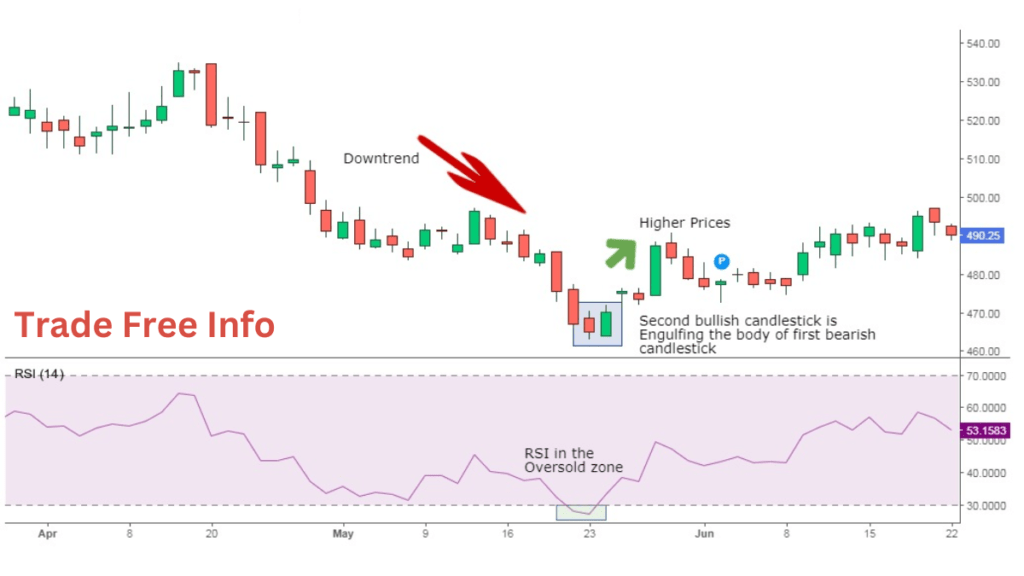
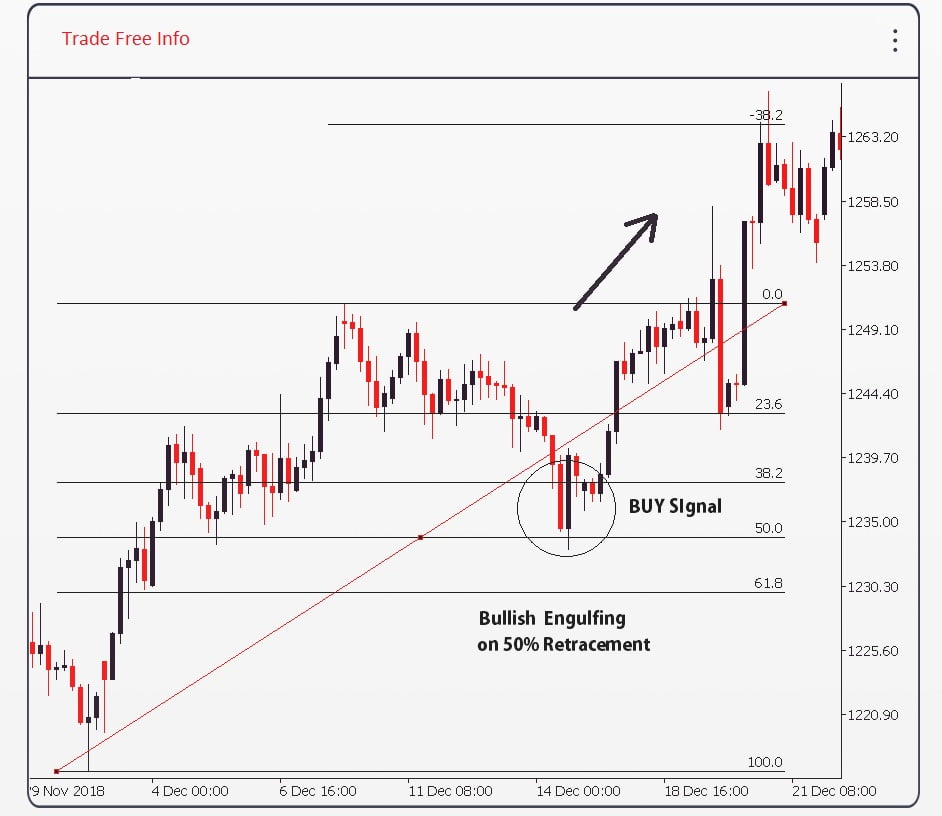
- Bullish Engulfing:
- Description: A bullish candlestick that “engulfs” the previous bearish candle, signaling a shift in momentum.
- Application: Traders see the Bullish Engulfing pattern as a strong buy signal, suggesting a potential trend reversal.
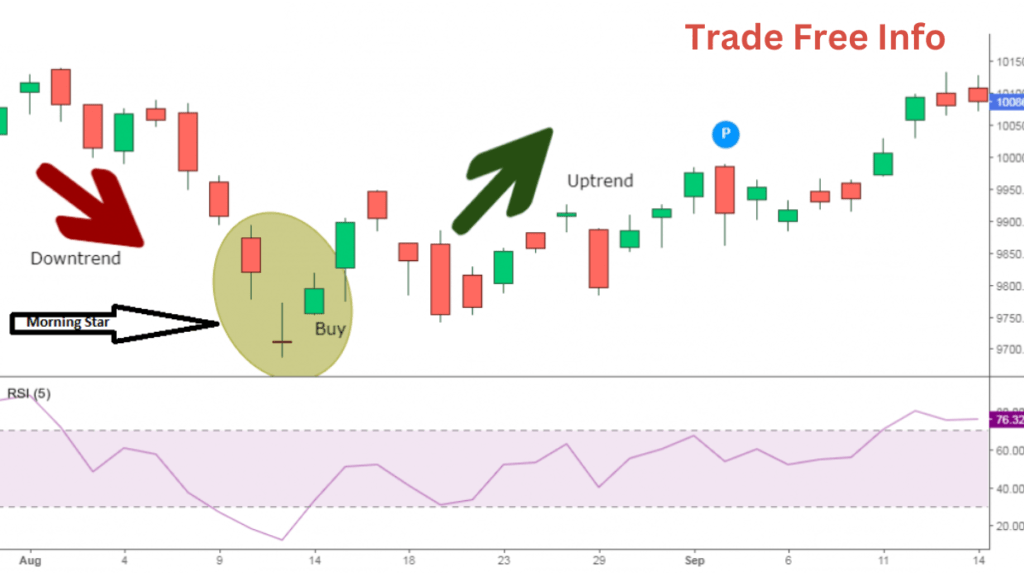
- Morning Star:
- Description: Comprising three candles – a bearish, a small-bodied, and a bullish candle – the Morning Star signals a potential bottom in a downtrend.
- Application: Traders use the Morning Star as an early indicator of a bullish reversal, guiding their buying decisions.
- Piercing Pattern:
- Description: This two-candle pattern involves a bearish candle followed by a bullish candle that closes at least halfway into the previous candle’s body.
- Application: Traders interpret the Piercing Pattern as a signal to go long, expecting a reversal in the prevailing downtrend.

B. Bearish Reversal Patterns
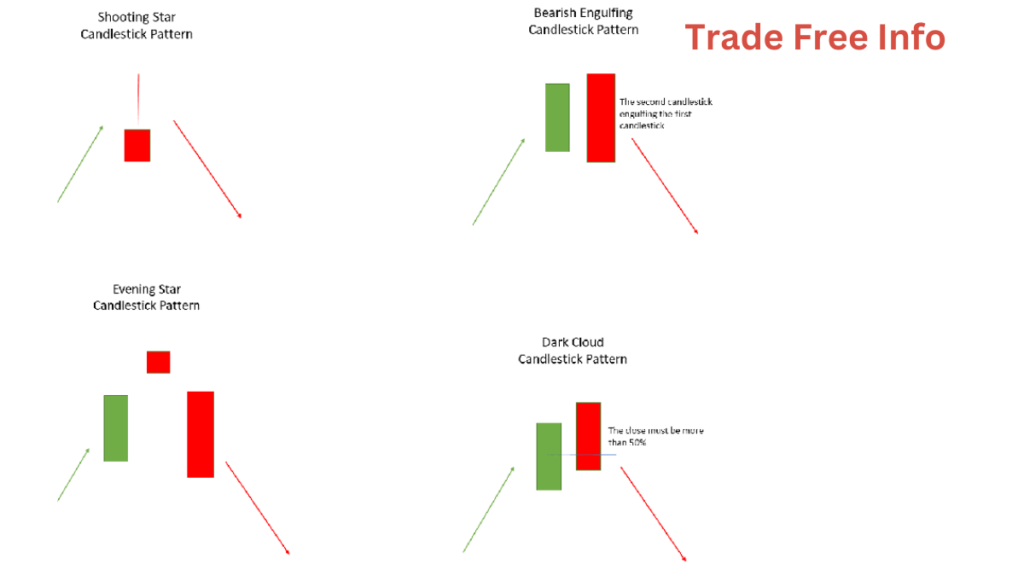
- Shooting Star:
- Description: The Shooting Star has a small real body at the lower end of the price range, signaling potential reversal after an uptrend.
- Application: Traders view the Shooting Star as a warning of a possible trend reversal, considering it a bearish signal.
- Bearish Engulfing:
- Description: Similar to its bullish counterpart, the Bearish Engulfing pattern signals a potential shift in momentum, with a bearish candle engulfing the previous bullish one.
- Application: Traders use the Bearish Engulfing pattern to identify potential entry points for short positions.
- Evening Star:
- Description: Comprising three candles – a bullish, a small-bodied, and a bearish candle – the Evening Star signals a potential top in an uptrend.
- Application: Traders interpret the Evening Star as an early indicator of a bearish reversal, guiding their selling decisions.
- Dark Cloud Cover:
- Description: This two-candle pattern involves a bullish candle followed by a bearish candle that closes at least halfway into the previous candle’s body.
- Application: Traders see the Dark Cloud Cover as a potential signal to go short, anticipating a reversal in the prevailing uptrend.
C. Continuation Patterns
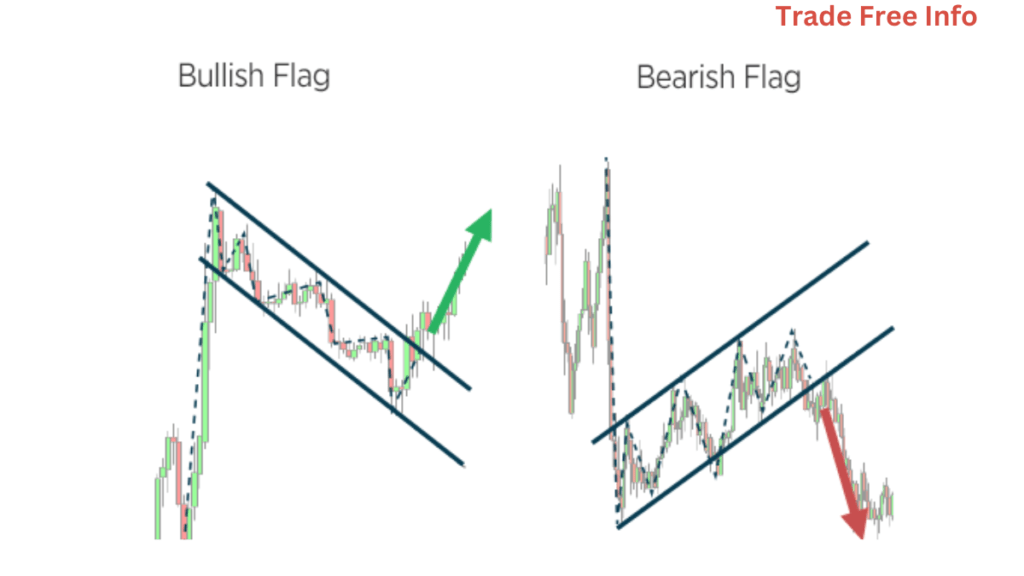
- Bullish Flag:
- Description: The Bullish Flag is a rectangular-shaped pattern that represents a temporary consolidation before the previous uptrend continues.
- Application: Traders consider the Bullish Flag as a continuation pattern, suggesting a potential resumption of the bullish trend.
- Bearish Flag:
- Description: Similar to the Bullish Flag but inverted, the Bearish Flag signals a temporary consolidation before the previous downtrend continues.
- Application: Traders interpret the Bearish Flag as a continuation pattern, anticipating a potential continuation of the bearish trend.
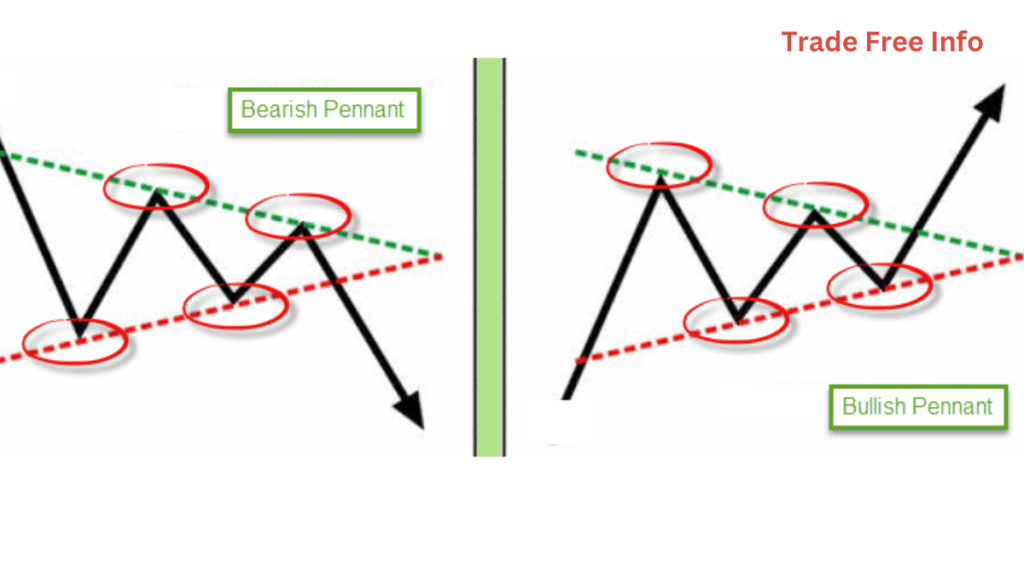
- Bullish Pennant:
- Description: The Bullish Pennant is a small symmetrical triangle that represents a brief consolidation before the previous uptrend resumes.
- Application: Traders see the Bullish Pennant as a continuation pattern, indicating a potential continuation of the bullish trend.
- Bearish Pennant:
- Description: Similar to the Bullish Pennant but inverted, the Bearish Pennant signals a brief consolidation before the previous downtrend resumes.
- Application: Traders interpret the Bearish Pennant as a continuation pattern, suggesting a potential continuation of the bearish trend.
D. Doji Patterns
- Gravestone Doji:
- Description: A Doji with a long upper shadow and little to no lower shadow, signaling indecision in the market.
- Application: Traders see the Gravestone Doji as a potential reversal signal, especially after an uptrend.
- Dragonfly Doji:
- Description: A Doji with a long lower shadow and little to no upper shadow, indicating market indecision.
- Application: Traders interpret the Dragonfly Doji as a potential reversal signal, especially after a downtrend.
- Long-Legged Doji:
- Description: A Doji with long upper and lower shadows, suggesting high market indecision.
- Application: Traders use the Long-Legged Doji as a signal to exercise caution, as it indicates uncertainty in the market.

3. Practical Application – Mastering Candlestick Patterns in Real Trades
Now that we’ve unraveled the intricacies of the top 16 candlestick patterns, it’s time to explore their practical applications in real-world trading scenarios. This section focuses on how traders can effectively use these patterns to inform their decisions, offering insights into identification, interpretation, and strategic implementation.
A. Identifying Patterns on Real Stock Charts
- Pattern Recognition Techniques:
- Candlestick Scanner Tools: Utilize online platforms and tools equipped with candlestick recognition features to swiftly identify patterns across various stocks.
- Manual Analysis: Develop the skill of manually scanning stock charts, honing your ability to spot patterns without relying solely on automated tools.
- Real-Time Chart Analysis:
- Intraday Trading: Apply candlestick patterns to intraday trading by analyzing shorter timeframes for quick decision-making.
- Swing Trading: Extend your analysis to longer timeframes for swing trading, aligning with the broader market trends indicated by candlestick patterns.
B. Tips for Accurate Pattern Recognition
- Confirmation Indicators:
- Volume Analysis: Confirm candlestick signals by analyzing trading volume. Increased volume often strengthens the reliability of the observed pattern.
- Support and Resistance Levels: Validate patterns by considering support and resistance levels, enhancing the precision of your trading decisions.
- Consideration for Market Context:
- Trend Analysis: Assess the prevailing market trend before relying on a candlestick pattern. Patterns are more impactful when aligned with the broader trend.
- Market Sentiment: Factor in overall market sentiment and news events to contextualize candlestick patterns within the current market environment.
C. Importance of Combining Candlestick Analysis with Other Indicators
- Moving Averages:
- Trend Confirmation: Combine candlestick patterns with moving averages to confirm trend directions, providing a more comprehensive view of market movements.
- Golden Cross and Death Cross: Use crossovers of short-term and long-term moving averages to validate potential trend reversals indicated by candlestick patterns.
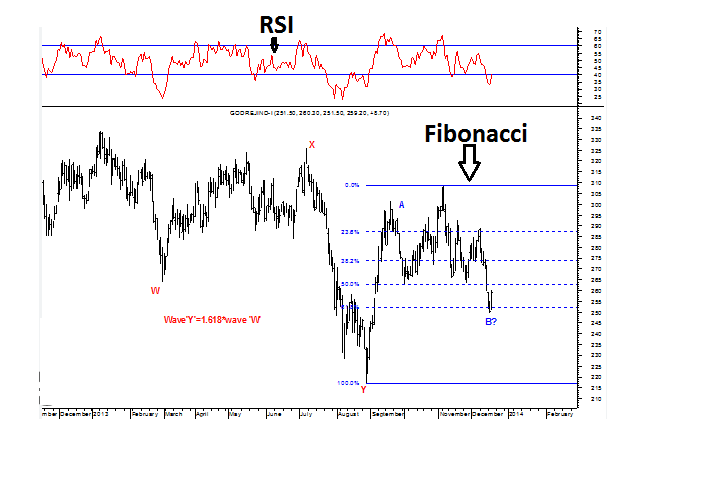
- Relative Strength Index (RSI):
- Overbought and Oversold Conditions: Integrate RSI with candlestick analysis to identify overbought or oversold market conditions, enhancing the precision of entry and exit points.
- Fibonacci Retracement Levels:
- Support and Resistance: Overlay Fibonacci retracement levels on candlestick charts to identify key support and resistance levels, aligning with potential reversal patterns.
4. Common Mistakes to Avoid – Navigating Pitfalls in Candlestick Chart Analysis
While mastering candlestick chart patterns can significantly enhance your trading acumen, it’s crucial to be aware of common pitfalls that traders may encounter. In this section, we’ll explore potential mistakes and misinterpretations to help you navigate the dynamic world of candlestick chart analysis with greater precision.
A. Misinterpretation of Patterns
- Overreliance on Single Patterns:
- Pitfall: Relying solely on one or two candlestick patterns may lead to oversights and false signals.
- Solution: Diversify your pattern analysis and consider the broader context, combining multiple indicators for more robust decision-making.
- Failure to Consider Timeframes:
- Pitfall: Neglecting to adjust your analysis for different timeframes can result in conflicting signals.
- Solution: Tailor your approach based on the timeframe of your trades, recognizing that patterns may have different significance in various timeframes.
B. Overreliance on Candlestick Signals
- Ignoring Confirmation Indicators:
- Pitfall: Trading based solely on candlestick patterns without confirmation from other technical indicators can lead to misguided decisions.
- Solution: Confirm signals with additional indicators like volume analysis, trendlines, or oscillators to strengthen the reliability of your trades.
- Neglecting Fundamental Analysis:
- Pitfall: Disregarding fundamental factors may result in overlooking broader market conditions impacting stock movements.
- Solution: Integrate fundamental analysis alongside candlestick patterns to gain a comprehensive understanding of the underlying assets.
C. Lack of Consideration for Market Context
- Ignoring Overall Market Trend:
- Pitfall: Failing to align candlestick patterns with the broader market trend can lead to counterproductive trades.
- Solution: Always assess the prevailing market trend and ensure that your trades align with the broader directional movement.
- Disregarding Economic Events:
- Pitfall: Neglecting major economic events and news releases may expose your trades to unexpected market volatility.
- Solution: Stay informed about economic calendars and news events to anticipate potential market movements that could impact your trades.
By understanding and actively avoiding these common mistakes, you can refine your approach to candlestick chart analysis and make more informed trading decisions. In the following section, we will explore advanced strategies, providing you with additional tools to enhance your trading prowess.
5. Advanced Strategies – Elevating Your Trading Game with Candlestick Patterns
As you progress in your journey of mastering candlestick chart analysis, incorporating advanced strategies can further enhance your trading precision. In this section, we’ll explore sophisticated techniques and strategies that leverage candlestick patterns in combination with other indicators for a more nuanced and strategic approach.
- Identifying Key Support and Resistance:
- Strategy: Overlaying Fibonacci retracement levels on candlestick charts helps identify critical support and resistance levels.
- Application: Combine these levels with candlestick patterns to confirm potential reversal points and strengthen your trade decisions.
- Aligning with Trend Direction:
- Strategy: Use Fibonacci retracement levels to determine the direction of the prevailing trend.
- Application: Align your trades with the trend direction indicated by Fibonacci levels, enhancing the probability of successful trades based on candlestick patterns.
B. Incorporating Volume Analysis for Confirmation
- Volume and Pattern Confirmation:
- Strategy: Analyze trading volume alongside candlestick patterns for confirmation.
- Application: Increased volume during pattern formations strengthens the reliability of the observed pattern, providing a more robust basis for your trading decisions.
- Volume Divergence as an Indicator:
- Strategy: Look for divergences between price movements and trading volume.
- Application: Divergences can signal potential trend reversals or weaknesses, adding an extra layer of confirmation to your candlestick analysis.
C. Case Studies Illustrating Successful Trades Based on Candlestick Signals
- Bullish Engulfing and Trend Reversal:
- Case Study: Explore instances where a Bullish Engulfing pattern led to a successful trend reversal.
- Analysis: Break down the factors contributing to the effectiveness of the pattern, providing insights into its application in real-world scenarios.
- Continuation Patterns in Strong Trends:
- Case Study: Examine how continuation patterns like Bullish Flags or Bearish Pennants played out in the context of strong trends.
- Analysis: Highlight the conditions under which these patterns are most effective, guiding traders in identifying suitable market environments.
6. Conclusion – Navigating the Dynamic World of Candlestick Charting
In conclusion, the exploration of candlestick chart patterns has unveiled a dynamic and insightful realm within the stock market. From understanding the basics to mastering advanced strategies, you’ve embarked on a journey that empowers you to make informed and strategic trading decisions.
Recall the foundational elements: the anatomy of candlesticks, their historical significance, and the advantages they offer in technical analysis. We’ve navigated through the top 16 candlestick patterns, learning how to identify, interpret, and apply them in real trades.
However, vigilance is key. Beware of common mistakes, such as misinterpretation of patterns, overreliance on signals, and neglecting market context. By avoiding these pitfalls, you can enhance the accuracy of your analyses.
For those seeking to take their skills to the next level, advanced strategies involving Fibonacci retracement levels, volume analysis, and real-world case studies provide a more nuanced approach to trading.
As you continue your journey in the ever-evolving stock market, remember that knowledge is your greatest asset. Stay curious, stay informed, and embrace the continuous learning process. Candlestick charting is both an art and a science, and by mastering it, you gain a powerful tool for navigating the complexities of financial markets.
May your candlestick analyses be precise, your trades be strategic, and your journey in the stock market be prosperous. Happy trading!
Frequently Asked Questions (FAQs) – Candlestick Chart Patterns in Stock Market Trading
Q1: What is the significance of candlestick chart patterns in stock market trading?
A1: Candlestick chart patterns offer a visual representation of price movements, providing traders with insights into market trends, reversals, and potential entry/exit points. They enhance technical analysis by incorporating the psychological aspect of market dynamics.
Q2: How do I identify candlestick patterns on stock charts?
A2: Identification involves recognizing specific shapes and formations created by candlesticks. Traders can manually scan charts or use online tools with candlestick recognition features to swiftly identify patterns. It’s essential to practice pattern recognition to become proficient.
Q3: Can I use candlestick patterns for different trading timeframes?
A3: Yes, candlestick patterns are versatile and can be applied to various timeframes, including intraday trading, swing trading, and long-term investing. The significance of patterns may vary based on the chosen timeframe.
Q4: What are some common mistakes to avoid when using candlestick patterns?
A4: Common mistakes include overreliance on a single pattern, neglecting confirmation indicators, ignoring overall market trends, and disregarding fundamental analysis. Diversifying pattern analysis and considering broader market context helps mitigate these pitfalls.
Q5: How can I use Fibonacci retracement levels with candlestick patterns?
A5: Overlay Fibonacci retracement levels on candlestick charts to identify key support and resistance levels. Align your trades with the trend direction indicated by Fibonacci levels, enhancing the probability of successful trades based on candlestick patterns.
Q6: Why is volume analysis important in candlestick charting?
A6: Volume analysis provides confirmation for candlestick signals. Increased volume during pattern formations strengthens the reliability of observed patterns, offering traders a more robust basis for their trading decisions.
Q7: Can beginners use advanced candlestick strategies?
A7: While beginners can learn and apply advanced strategies, it’s advisable to start with the basics and gradually incorporate advanced techniques as proficiency grows. Building a strong foundation ensures a better understanding of complex strategies.
Q8: How can I stay updated on economic events impacting my trades?
A8: Stay informed by regularly checking economic calendars, financial news outlets, and updates from reputable financial sources. Being aware of economic events helps anticipate potential market movements that could impact your trades.
Q9: Is continuous learning important in candlestick charting?
A9: Absolutely. The stock market is dynamic, and continuous learning is crucial for staying informed about new patterns, strategies, and market trends. Regularly updating your knowledge ensures you adapt to the ever-evolving landscape of financial markets.
Q10: Where can I find more resources to deepen my understanding of candlestick charting?
A10: Explore reputable financial websites, educational platforms, and books dedicated to technical analysis and candlestick charting. Engaging with online trading communities can also provide valuable insights and discussions.